Save Harrow's Green Belt
Introduction
Just before Christmas, on 16th December 2025, the Labour Government brought out their proposals for changes to planning regulations which include development in the Green Belt. The consultation on these proposals lasts until 11:45 pm on 10th March 2026. Harrow Liberal Democrats have examined these proposals and believe that they constitute a major threat to the Green Belt in Harrow.
The proposals
Hansard for 16th December 2025 contains both the written submission and the verbal statement by Matthew Pennycook, Housing Minister, in which he answers questions from MPs. The proposals themselves are on the Governments’ web site, where they list also questions about the proposals and links to reply either online or by email.
Some of the proposals, like the requirement for swift bricks in new-build houses, which provide nesting sites for a number of species of small birds, not just swifts, are welcome. This article specifically looks at the consequences of development in the Green Belt within walking distance of railway stations.
Policy L3 paragraph 3 (on page 56) states:
Minimum densities for residential development proposals are appropriate in locations which provide high levels of connectivity to jobs and services. Where development proposals for housing or mixed-use schemes are within reasonable walking distance of a railway station44, a density of at least 40 dwellings per hectare should be achieved within the net developable area of the site, or 50 dwellings per hectare* where the station or stop is defined as ‘well-connected’45.
Footnotes
44 For the purpose of this policy references to railway stations also includes stops on underground, tram and other light rail systems.
45 Well-connected rail stations and underground, tram and light rail stops are those in a top 60 Travel to Work Area located partially or fully within England by Gross Value Added (GVA) and which, in the normal weekday timetable, are served (or have a reasonable prospect of being served due to planned upgrades or through agreement with the rail operator) throughout the daytime by four trains or trams per hour overall, or two trains or trams per hour in any one direction.
(* 50 houses per hectare is equivalent to each house sitting on a 20m x 10m plot, with the length of the plot being measured from the middle of the road in front of the house. Additional green space in an estate would reduce plot sizes. )
Policy GB3 (on page 59) states:
Green Belt boundaries should be altered through the preparation and updating of local plans and where:
a. This would enable the development of land around stations;
The Glossary (p110) defines Previously developed land: Land which has been lawfully developed and is or was occupied by a permanent structure and any fixed surface infrastructure associated with it, including the curtilage of the developed land (although it should not be assumed that the whole of the curtilage should be developed). It also includes land comprising large areas of fixed surface infrastructure such as large areas of hardstanding which have been lawfully developed. Previously developed land excludes: land that is or was last occupied by agricultural or forestry buildings; land that has been developed for minerals extraction or waste disposal by landfill, where provision for restoration has been made through development management procedures; land in built-up areas such as residential gardens, parks, recreation grounds and allotments; and land that was previously developed but where the remains of the permanent structure or fixed surface structure have blended into the landscape.
In addition there is the London Plan. There was a consultation on the next iteration of this plan last year and although this is now closed you can still download the consultation document and the draft London Plan itself will be published in 2026.
Effects on Harrow’s Green Belt
1. Stanmore Station
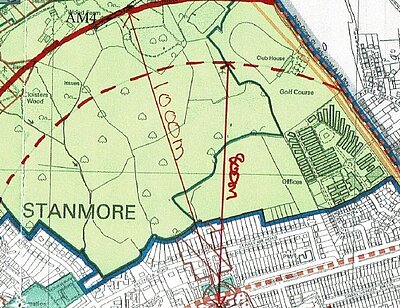
Matthew Pennycook’s estimate of about 800 metres as walking distance was a response to a verbal question on his statement in the Commons. This is quite slow walking; Transport for London assumes 5 kph (3.1 mph) for walking speed, which would correspond to 1.25 km in 15 minutes. Against this, walking in a built-up area would be by the side of roads rather than in a straight line, so 800-1000 metres as the crow flies seems reasonable. Development could also take place on the eastern side of Brockley Hill, where housing already extends further north than on the western side, but as this is in the London Borough of Barnet, we have not considered it.
Turning to the Green Belt north of London Road, the one recent development here has been the replacement of the old Government Offices site at the foot of Brockley Hill with housing. This was already permitted development because the foot-print of the housing did not exceed the foot-print of the original offices. A similar rule applied to the re-development of the old GEC-Marconi site in Warren Lane and would apply to any development of the RNOH.
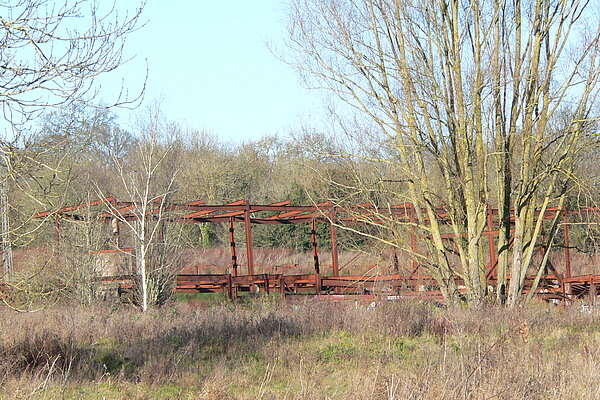
Further up Brockley Hill from this development is the disused driving range. At one time this was a combined driving range and par-3 golf course, but has long been abandoned. There used to be a par-3 golf course too next to the A41 which is now called The Lost Jungle and is a combination of a conventional par-3 course and ‘adventure golf’.
In the past, the only acceptable use for the driving range would have been another recreational use, but now this site may now be defined as “grey-belt” rather than “green-belt”; the Government is not entirely clear on how they distinguish between these. At around 8 hectares it could mean an extra 400 houses.
The other site in Stanmore’s Green Belt that is particularly in danger is the south-eastern corner of Stanmore Country Park which, even thirty years ago was not rated as a site of nature conservation importance (the green line separating the wooded from non-wooded area above).
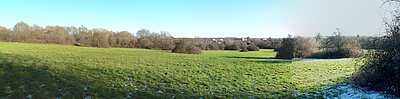
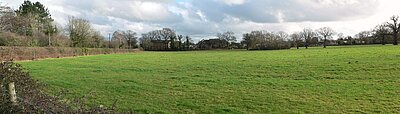
This is a view of this area, where there is already housing development on two sides and if the old driving range site were deemed to be “grey belt” it would be difficult to argue that this should be preserved as green belt land because of its proximity to Stanmore Station and no other redeeming features. The area of this is comparable to the driving range site, so potentially another 400 houses.
2. Hatch End Station
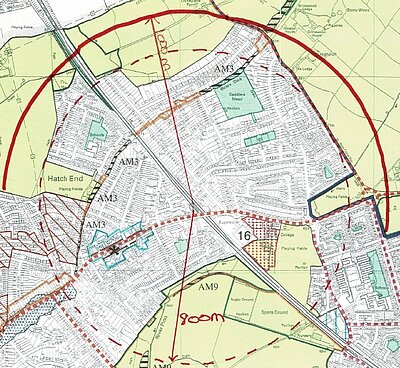
This shows the parts of the Green Belt within walking distance of Hatch End Station. There is limited opportunity for development on the northern side because South Oxhey comes nearly right up to the boundary with Harrow to the west of the railway line and the proximity of Carpenders Park Station may mean further development outside Harrow to the east of the railway line. The need to preserve some vestige of Green Belt argues against development here.
Similarly, on the southern side almost all of the land within walking distance of Hatch End Station is also within walking distance of Headstone Lane Station. The one significant area of Green Belt that could be designated for development on the basis of being within walking distance of Hatch End Station is the eastern side of Oxhey Lane in Harrow Weald ward, where the western side in Hatch End ward is already developed.
3. Headstone Lane Station
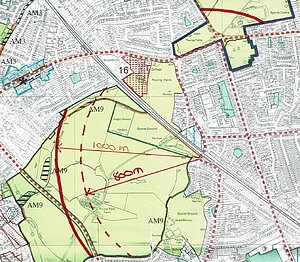
Walking distance from Headstone Lane Station covers almost all of Pinner Park Farm to the east of King George V Avenue and the south-western corner of the Green Belt in Harrow Weald ward. Much of the land in this area that is not farmland are playing fields and would need to be protected for recreational use under this heading rather than as Green Belt.
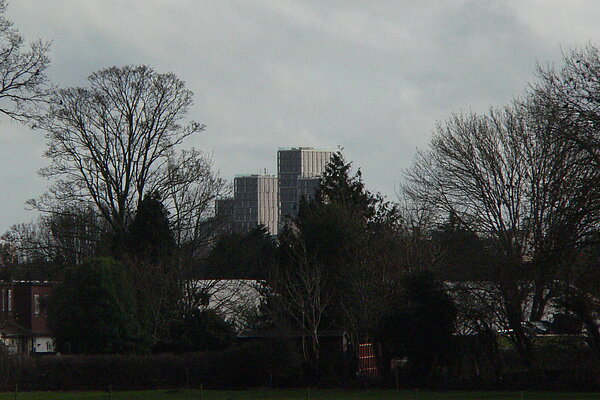
The visible houses towards the centre of the image are those on roads off Headstone Lane. The flats in College Road are just visible near the right-hand side.
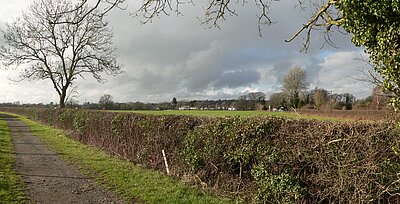
These pictures illustrate just how rural this part of Harrow is, but the Government’s new planning regulations would turn the whole of this area into one big housing estate and only provide sufficient housing for just over two years at the building rate they demand.
4. Pinner Station
King George V Avenue is less than 1 km from Pinner Station at its closest point and the bridleway from there to Pinner brings most of Pinner Park Farm to the west of this road within walking distance of Pinner Station.
Housing Calculations and supply
Annex D (pages 116-118 of the draft planning regulations) sets out how the housing need is calculated. Harrow has approximately 94,000 dwellings at present and the baseline sets the minimum annual housing need. Before corrections this is 0.8% annually, so 752 houses/year or 3760 over the five-year period. But Harrow is an expensive place to live with median house prices for the last five years averaging 15.38 times median earnings (Cell AG189 in Table 5c in the ONS spreadsheet)
The Government applies an Adjustment Factor = ((five year average affordability ratio-5)/5)×0.95 + 1 for areas where housing is already expensive.
Applying their adjustment factor increases the number of new dwellings required over the five-year period by a factor of 2.97 to nearly 11,200 houses. Building over the whole of Pinner Park Farm (96.83 hectares) at a density of 50 houses/hectare would not even go half-way to meeting the five-year target, so that means much of Harrow’s precious Green Belt would have to go under bricks and concrete to meet Labour’s arbitrary building targets. Even adding another 400 houses to the east of Oxhey Lane, and 800 houses in Stanmore would provide only just over two-and-a-half years capacity at the building rate required.
The London Plan recognises the limitations of Green Belt development and how much development has already been completed recently in Harrow and Wealdstone. Overall, the building rate demanded by the National Guidelines has only been exceeded during the 1930s when Harrow was transformed from scattered villages surrounded by farms to the Metroland we know today (see Figure 2.1 on page 19). The London Plan advocates a brownfield-first approach (Section 2.1 on page 22) where Harrow and Wealdstone is classified as an Underway to Maturing Opportunity Area. Section 4.1 (page 52) of the London Plan observes that much of London is low-rise, lacking the mid-rise development (5-9 storeys) of many European cities; indeed this mid-rise development was a characteristic of the late-Victorian mansion blocks in areas like Maida Vale that are still popular places to live.
What protection of the Green Belt is left and why do we need to continue to protect it?
Annex E (pages 119-121) sets out strong, moderate and weak criteria for preservation of Green Belt land from development. We would argue that the limited amount of Green Belt and its importance to the character of Harrow means that we need to save it from being developed unless development is absolutely unavoidable.
But the Green Belt is more important than just providing good views and places to walk in the countryside that are easily accessible, it also means that people living in Harrow have lower air pollution than those in Central London. The image below is extracted from a map showing the whole of London’s air pollution levels, available on the Mayor of London’s web site. A study in 2019 modelled concentrations for a number of atmospheric pollutants including predictions for levels in 2025 and 2030 based on new policies like ULEZ. The image below shows predicted average annual NOx pollution (caused by vehicles with internal combustion engines, gas boilers and stoves, wood-burning fires etc) in 2025. A different representation showing how NO2 pollution has reduced over time in Central, Inner and Outer London is shown in Figure 5.3 on page 74 of the consultation document, but it still shows a significantly higher level at the roadside, compared with the general urban background.
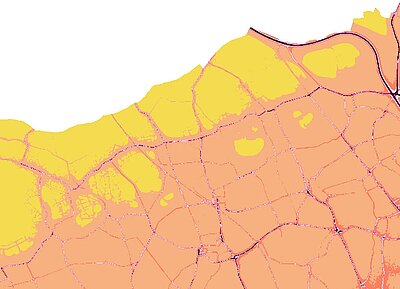
Our Green Belt areas stand out as having lower air pollution (15-20 μg/m³ (yellow), compared with 20-25 μg/m³ (pink) in most residential areas and even higher near main roads). Our Green Belt areas are the lungs of London and we need to preserve them.
What Can I do?
- First, respond to the consultation before it closes. The Government needs to understand that destroying Harrow’s Green Belt because their arbitrary affordability criteria dictate building on more than two square kilometers (220 hectares) of it within the next five years will only result in higher atmospheric pollution and more ill-health and deaths amongst Harrow residents.
- Secondly, write to your MP to complain. It is only when the Government comes under pressure in the House of Commons that they will start to look again at their proposals.
- Thirdly, if you normally vote Labour, vote tactically instead on May 7th. We would like that tactical vote to be for the Liberal Democrats, but there are other left-of-centre parties. Every Labour councillor who loses their seat in May, particularly in the Harrow West constituency, will be sending a signal to the Government that they need to U-turn on these ill-conceived proposals.